Code examples
Consider making simple charts from semantic markup
<dl class="bar-chart">
  <dt>Monthly usage</dt>
  <dd class="percentage-57">
    <span class="date">March</span>
    <span class="value">57%</span>
  </dd>
  <dd class="percentage-42">
    <span class="date">April</span>
    <span class="value">42%</span>
  </dd>
  <dd class="percentage-91">
    <span class="date">May</span>
    <span class="value">91%</span>
  </dd>
</dl>Provide alternative ways to consume visual content
If there is one primary message for an chart that is displayed as an image file, describe it in the alt attribute.
<img src="monthly-usage-chart.jpg"
     alt="Usage shows a large jump in May to 91%">
Provide alternative ways to consume data
If you have a figure that can’t be described by alt text, place the content in a different format.
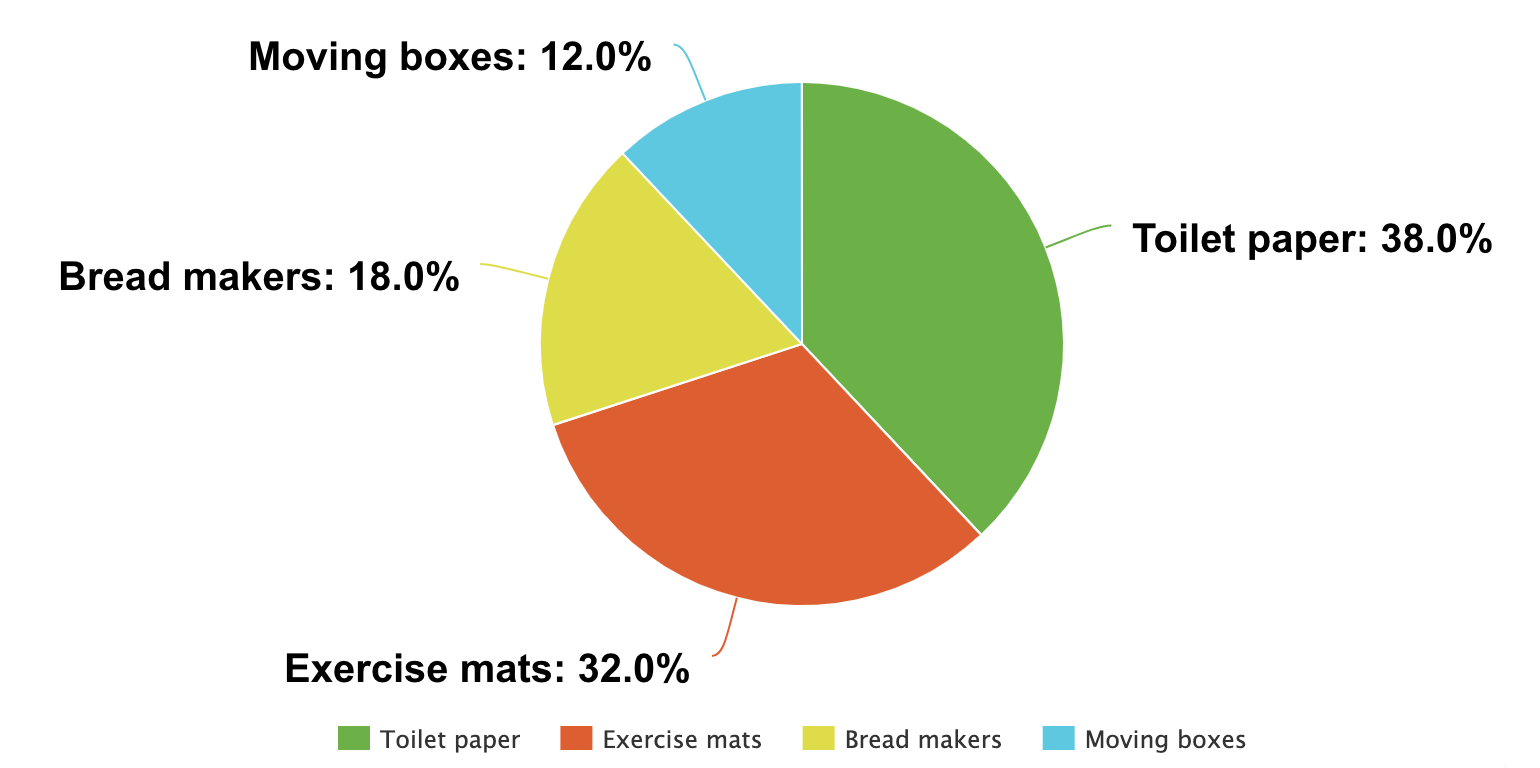
2020 sales
| Toilet paper | Bread makers | Moving boxes | Exercise mats |
|---|---|---|---|
| 38% | 18% | 12% | 32% |
<figure>
  <img
    src="/assets/images/examples/pie-chart.png"
    alt="2020 sales by item">

  <details>
    <summary>
      2020 sales
    </summary>

    <table id="sales-breakdown">
        <caption>
          Breakdown of 2020 sales percentages by item
        </caption>
        <thead>
          <tr>
            <th scope="column">
              Toilet paper
            </th>
            <th scope="column">
              Bread makers
            </th>
            <th scope="column">
              Moving boxes
            </th>
            <th scope="column">
              Exercise mats
            </th>
          </tr>
        </thead>
        <tbody>
          <tr>
            <td>
              38%
            </td>
            <td>
              18%
            </td>
            <td>
              12%
            </td>
            <td>
              32%
            </td>
          </tr>
        </tbody>
      </table>
  </details>
</figure>
Provide alternative interactions with dynamic figures
When building maps, add a search or filtering feature for those who can’t use a mouse.
<map-embed></map-embed>

<form role="search"
      aria-label="Location search">
  <label for="search">
    Search for a location
  </label>
  <input type="search" id="search">
  <button type="submit">
    Search
  </button>
</form>
Developer notes
Name
- Use
alt="Descriptive figure content"for images - Supply a heading for interactive figures or
aria-label="Figure name"can be used as well
Role
- Wrap charts and tables in a
<figure>element where applicable - Include
<figcaption>to describe the figure - Use
<cite>to label sources
Group
- Provide alternative ways to consume content
- Examples:
- A map of phone coverage areas includes a search function
- A chart embedded as an image includes a table of the data
- A graphic showing phone plan benefits is followed by an unordered list of the benefits below a plan name heading.
- Examples: